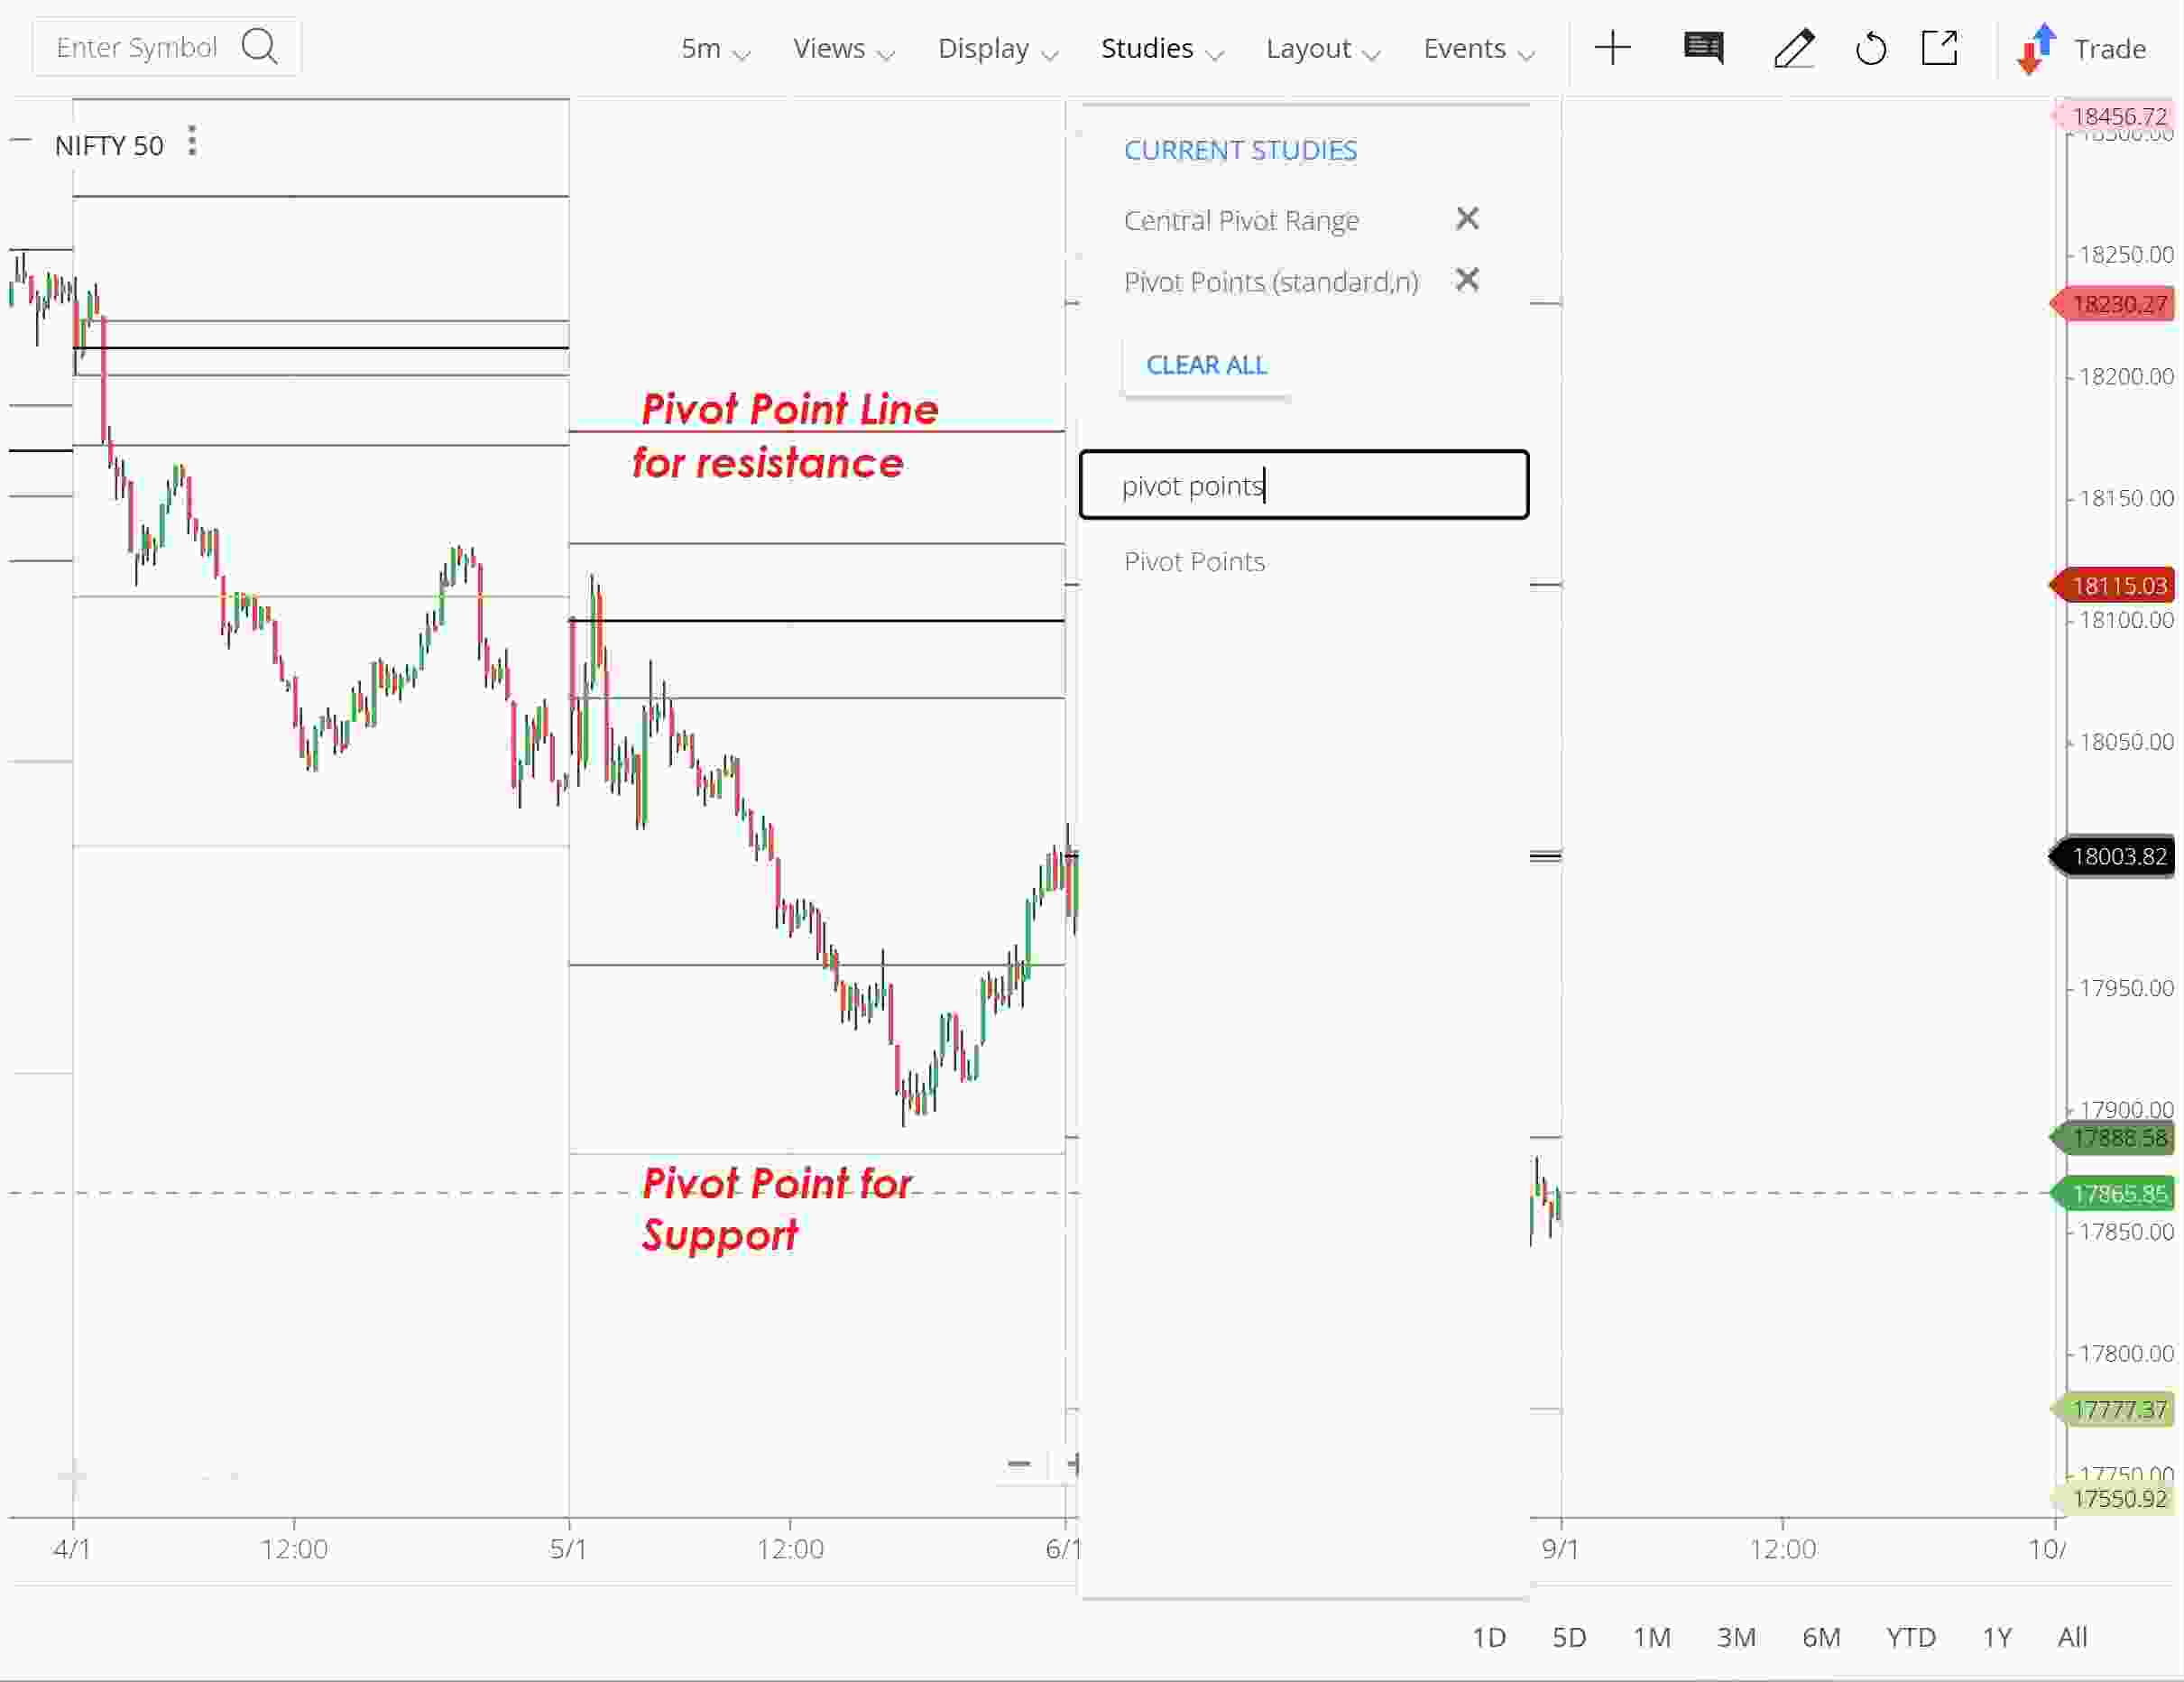

Pivot points are technical analysis indicators that are used to determine the overall trend of an asset. They are calculated using the high, low, and close prices of an asset over a certain time period, such as a day, week, or month. Pivot points are used by traders to identify potential support and resistance levels in the market.
There are several different methods for calculating pivot points, but one common method is the 5-point pivot point system. This system calculates the pivot point as the average of the high, low, and close prices from the previous period, and then uses this value to calculate three levels of support and three levels of resistance for the current period. The support levels are considered to be price levels where the asset may find buying interest and potentially stop its decline, while the resistance levels are considered to be price levels where the asset may encounter selling pressure and potentially stop its advance.
Pivot points are often used in conjunction with other technical analysis tools, such as trend lines and candlestick patterns, to help traders make informed decisions about the direction of an asset's price. However, it is important to note that pivot points should be used as a guide rather than a definitive indicator of market direction, and that they may not always accurately predict price movements.
How to enable Pivot-points in Brocker Acocunt?
1. Login to Zerodha.
2. Create watchlist of Tickers(Nifty50/BankNifty/Any other stock)
3. Click on Study as shown in Figure below and type pivot points.
4. Select Pivot Points.
5. The lines marked in Red are called "Resistance" and lines marked in Green are called "Support". Learn more about support and resistance here.

Get full access to all training courses.